Explore the top website performance metrics for optimal user experience.
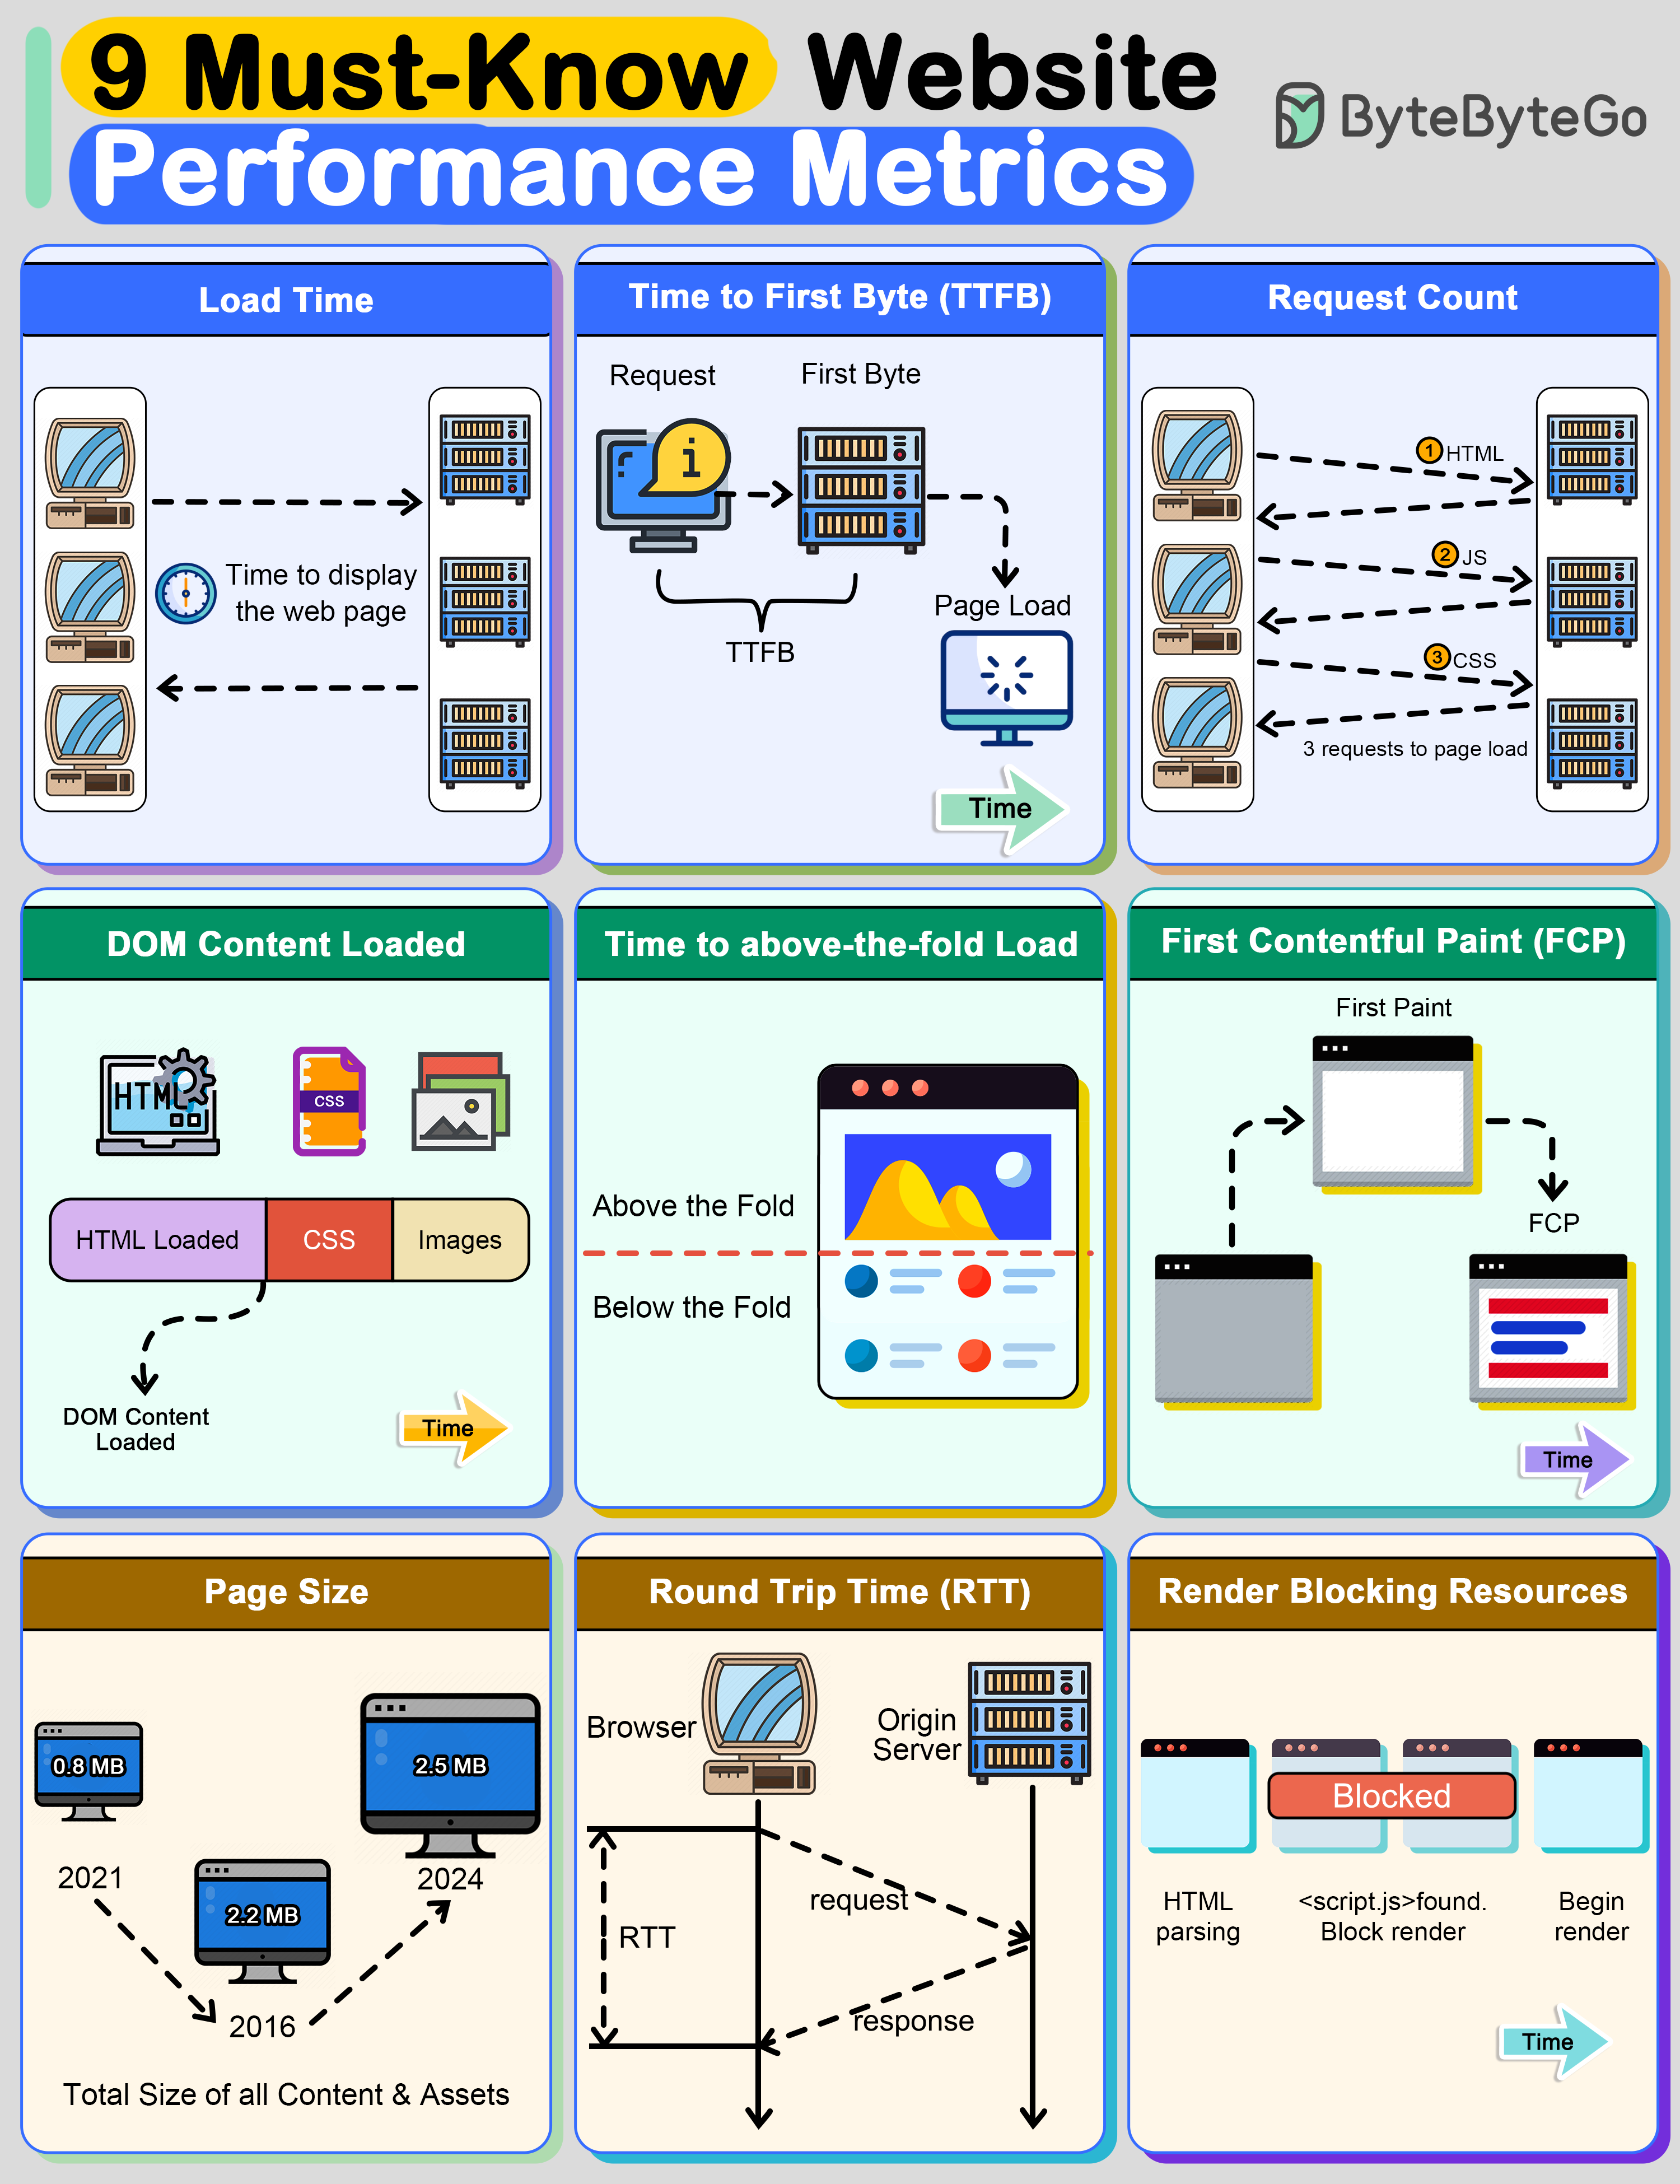
This is the time taken by the web browser to download and display the webpage. It’s measured in milliseconds.
It’s the time taken by the browser to receive the first byte of data from the web server. TTFB is crucial because it indicates the general ability of the server to handle traffic.
The number of HTTP requests a browser has to make to fully load the page. The lower this count, the faster a website will feel to the user.
This is the time it takes for the full HTML code of a webpage to be loaded. The faster this happens, the faster users can see useful functionality. This time doesn’t include loading CSS and other assets
“Above the fold” is the area of a webpage that fits in a browser window without a user having to scroll down. This is the content that is first seen by the user and often dictates whether they’ll continue reading the webpage.
This is the time at which content first begins to be “painted” by the browser. It can be a text, image, or even background color.
This is the total file size of all content and assets that appear on the page. Over the last several years, the page size of websites has been growing constantly. The bigger the size of a webpage, the longer it will take to load
This is the amount of time a round trip takes. A round trip constitutes a request traveling from the browser to the origin server and the response from the server going to the browser. Reducing RTT is one of the key approaches to improving a website’s performance.
Some resources block other parts of the page from being loaded. It’s important to track the number of such resources. The more render-blocking resources a webpage has, the greater the delay for the browser to load the page.
